| NewsServer Node 2 (perseus) |
Unknown entries from news log file:
First 5 / 50 lines (10.0%)
Aug 9 03:02:46 perseus nnrpd[28401]: nnrpd getpeername failed with code 107(Transport endpoint is not connected)
Aug 9 03:11:46 perseus nnrpd[29284]: nnrpd getpeername failed with code 107(Transport endpoint is not connected)
Aug 9 03:12:17 perseus nnrpd[29287]: nnrpd getpeername failed with code 107(Transport endpoint is not connected)
Aug 9 03:12:45 perseus nnrpd[29293]: nnrpd getpeername failed with code 107(Transport endpoint is not connected)
Aug 9 03:13:23 perseus nnrpd[29296]: nnrpd getpeername failed with code 107(Transport endpoint is not connected)
| Program name | Lines | %Lines | Size | %Size |
|---|---|---|---|---|
| inn | 562474 | 94.2% | 53.4 MB | 93.4% |
| nnrpd | 18602 | 3.1% | 1.8 MB | 3.1% |
| innd | 13820 | 2.3% | 1.6 MB | 2.8% |
| cnfsstat | 2304 | 0.4% | 395.3 KB | 0.7% |
| expireover | 1 | 0.0% | 0.1 KB | 0.0% |
| TOTAL: 5 | 597201 | 100.0% | 57.2 MB | 100.0% |
| Reason | Count | %Count |
|---|---|---|
| Do not exist | 561315 | 91.9% |
| Negative hits | 49077 | 8.0% |
| Positive hits | 573 | 0.1% |
| Cache misses | 74 | 0.0% |
| TOTAL: 4 | 611039 | 100.0% |
| Code region | Time | Pct | Invoked | Min(ms) | Avg(ms) | Max(ms) |
|---|---|---|---|---|---|---|
| article cancel | 00:00:00.113 | 0.0% | 432 | 0.000 | 0.262 | 25.000 |
| article cleanup | 00:00:04.807 | 0.0% | 561572 | 0.000 | 0.009 | 0.034 |
| article logging | 00:01:49.555 | 0.1% | 561693 | 0.000 | 0.195 | 27.696 |
| article parse | 00:02:21.848 | 0.2% | 4710116 | 0.009 | 0.030 | 0.164 |
| article write | 00:29:55.401 | 2.1% | 482851 | 0.112 | 3.718 | 33.118 |
| artlog/artcncl | 00:00:00.004 | 0.0% | 432 | 0.000 | 0.009 | 1.000 |
| artlog/artparse | 00:00:00.000 | 0.0% | 0 | 0.000 | 0.000 | 0.000 |
| data move | 00:00:16.111 | 0.0% | 6827644 | 0.000 | 0.002 | 0.015 |
| hisgrep/artcncl | 00:00:00.104 | 0.0% | 424 | 0.000 | 0.245 | 25.000 |
| hishave/artcncl | 00:00:00.001 | 0.0% | 432 | 0.000 | 0.002 | 1.000 |
| history grep | 00:00:00.000 | 0.0% | 0 | 0.000 | 0.000 | 0.000 |
| history lookup | 00:03:03.466 | 0.2% | 610824 | 0.000 | 0.300 | 26.695 |
| history sync | 00:00:08.830 | 0.0% | 466 | 0.000 | 18.948 | 8469.000 |
| history write | 00:15:23.099 | 1.1% | 482851 | 0.000 | 1.912 | 49.963 |
| hiswrite/artcncl | 00:00:00.000 | 0.0% | 8 | 0.000 | 0.000 | 0.000 |
| idle | 21:12:03.782 | 88.3% | 4524142 | 0.000 | 16.870 | 84.618 |
| nntp read | 00:01:48.260 | 0.1% | 4693629 | 0.005 | 0.023 | 0.150 |
| overview write | 01:51:41.565 | 7.8% | 482851 | 0.236 | 13.879 | 6325.208 |
| perl filter | 00:00:00.000 | 0.0% | 0 | 0.000 | 0.000 | 0.000 |
| python filter | 00:00:00.000 | 0.0% | 0 | 0.000 | 0.000 | 0.000 |
| site send | 00:00:00.000 | 0.0% | 0 | 0.000 | 0.000 | 0.000 |
| TOTAL: 24:00:05.703 | 23:58:36.946 | 99.9% | - | - | - | - |
| Code region | Time | Pct | Invoked | Min(ms) | Avg(ms) | Max(ms) |
|---|---|---|---|---|---|---|
| hisgrep | 00:00:18.070 | 0.0% | 56099 | 0.000 | 0.322 | 0.000 |
| idle | 12:11:39.719 | 98.1% | 118262 | 0.000 | 371.207 | 387.851 |
| newnews | 00:00:00.000 | 0.0% | 0 | 0.000 | 0.000 | 0.000 |
| nntpwrite | 00:00:21.099 | 0.0% | 354758 | 0.000 | 0.059 | 0.000 |
| readart | 00:07:40.673 | 1.0% | 290321 | 0.000 | 1.587 | 0.000 |
| TOTAL: 12:25:31.077 | 12:19:59.561 | 99.3% | - | - | - | - |
| Command | Number |
|---|---|
| flush | 144 |
| flushlogs | 1 |
| paused | 2 |
| TOTAL: 3 | 147 |
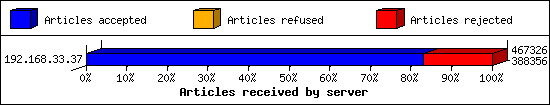
| Server | Connects | Offered | Taken | Refused | Reject | %Accpt | Elapsed | |
|---|---|---|---|---|---|---|---|---|
| 1 | 192.168.33.37 | 1894 | 467326 | 388356 | 192 | 78778 | 83% | 312:06:40 |
| TOTAL: 1 | 1894 | 467326 | 388356 | 192 | 78778 | 83% | 312:06:40 | |
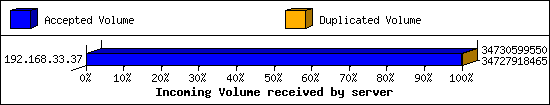
| Server | AcceptVol | DupVol | TotalVol | %Acc | Vol/Art | Elapsed | |
|---|---|---|---|---|---|---|---|
| 1 | 192.168.33.37 | 32.3 GB | 2.6 MB | 32.3 GB | 99% | 72.6 KB | 312:06:40 |
| TOTAL: 1 | 32.3 GB | 2.6 MB | 32.3 GB | 99% | 72.6 KB | 312:06:40 | |
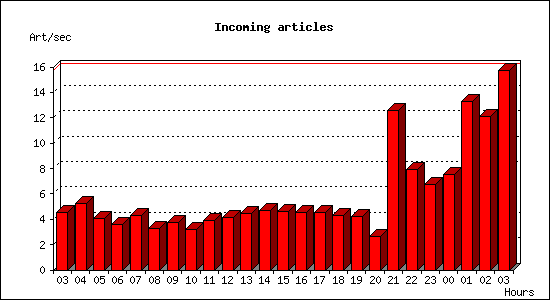
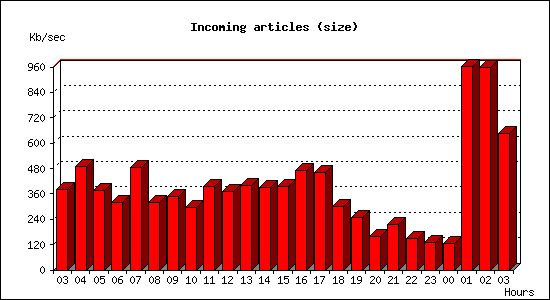
| Date | Articles | %Arts | Art/sec | Size | %Size | KB/sec |
|---|---|---|---|---|---|---|
| Aug 9 03:00:02 - 03:59:59 | 16395 | 3.4% | 4.56 | 1.3 GB | 4.2% | 381.04 |
| Aug 9 04:00:00 - 04:59:59 | 18905 | 3.9% | 5.25 | 1.7 GB | 5.4% | 490.85 |
| Aug 9 05:00:00 - 05:59:59 | 14731 | 3.0% | 4.09 | 1.3 GB | 4.1% | 377.03 |
| Aug 9 06:00:00 - 06:59:59 | 12839 | 2.7% | 3.57 | 1.1 GB | 3.5% | 319.20 |
| Aug 9 07:00:00 - 07:59:59 | 15587 | 3.2% | 4.33 | 1.7 GB | 5.3% | 486.17 |
| Aug 9 08:00:00 - 08:59:59 | 11842 | 2.5% | 3.29 | 1.1 GB | 3.5% | 317.23 |
| Aug 9 09:00:00 - 09:59:59 | 13416 | 2.8% | 3.73 | 1.2 GB | 3.8% | 349.88 |
| Aug 9 10:00:00 - 10:59:59 | 11495 | 2.4% | 3.19 | 1.0 GB | 3.2% | 293.74 |
| Aug 9 11:00:00 - 11:59:59 | 13935 | 2.9% | 3.87 | 1.4 GB | 4.3% | 395.92 |
| Aug 9 12:00:00 - 12:59:59 | 14951 | 3.1% | 4.15 | 1.3 GB | 4.1% | 373.07 |
| Aug 9 13:00:00 - 13:59:59 | 16014 | 3.3% | 4.45 | 1.4 GB | 4.4% | 400.66 |
| Aug 9 14:00:00 - 14:59:59 | 16919 | 3.5% | 4.70 | 1.3 GB | 4.3% | 392.50 |
| Aug 9 15:00:00 - 15:59:59 | 16690 | 3.5% | 4.64 | 1.4 GB | 4.3% | 393.23 |
| Aug 9 16:00:00 - 16:59:59 | 16427 | 3.4% | 4.56 | 1.6 GB | 5.1% | 469.47 |
| Aug 9 17:00:00 - 17:59:59 | 16293 | 3.4% | 4.53 | 1.6 GB | 5.1% | 463.44 |
| Aug 9 18:00:00 - 18:59:59 | 15558 | 3.2% | 4.32 | 1.0 GB | 3.3% | 298.88 |
| Aug 9 19:00:00 - 19:59:59 | 15165 | 3.1% | 4.21 | 872.4 MB | 2.7% | 248.16 |
| Aug 9 20:00:00 - 20:59:59 | 9403 | 1.9% | 2.61 | 557.1 MB | 1.7% | 158.45 |
| Aug 9 21:00:00 - 21:59:59 | 45364 | 9.4% | 12.60 | 757.3 MB | 2.4% | 215.41 |
| Aug 9 22:00:00 - 22:59:59 | 28639 | 5.9% | 7.96 | 522.7 MB | 1.6% | 148.67 |
| Aug 9 23:00:00 - 23:59:59 | 24149 | 5.0% | 6.71 | 451.9 MB | 1.4% | 128.55 |
| Aug 10 00:00:00 - 00:59:59 | 27006 | 5.6% | 7.50 | 439.5 MB | 1.4% | 125.02 |
| Aug 10 01:00:00 - 01:59:59 | 47802 | 9.9% | 13.28 | 3.3 GB | 10.5% | 960.54 |
| Aug 10 02:00:00 - 02:59:59 | 43665 | 9.0% | 12.13 | 3.3 GB | 10.5% | 955.52 |
| Aug 10 03:00:00 - 03:00:04 | 63 | 0.0% | 15.75 | 2.5 MB | 0.0% | 646.79 |
| TOTAL: 24:00:02 | 483253 | 100.0% | 5.59 | 31.4 GB | 100.0% | 380.96 |
| Buffer | Class | Size | Used | %Used | Cycles | KB/sec | Days |
|---|---|---|---|---|---|---|---|
| 01 | BIN | 137.8 GB | 11.8 GB | 8.6% | 341 | 63.44 | 26.36 |
| 02 | BIN | 137.8 GB | 30.0 GB | 21.8% | 341 | 63.44 | 26.36 |
| 03 | SMALL | 13.0 GB | 8.3 GB | 63.9% | 70 | 2.90 | 54.54 |
| 04 | BIN | 80.1 GB | 17.1 GB | 21.3% | 274 | 31.73 | 30.64 |
| 05 | BIN | 80.1 GB | 4.1 GB | 5.2% | 294 | 31.60 | 30.76 |
| 06 | SMALL | 13.0 GB | 8.2 GB | 63.0% | 70 | 2.91 | 54.30 |
| 07 | BIN | 80.1 GB | 74.6 GB | 93.1% | 273 | 31.62 | 30.74 |
| 08 | BIN | 80.1 GB | 13.0 GB | 16.3% | 294 | 31.71 | 30.65 |
| 09 | SMALL | 13.0 GB | 6.8 GB | 52.1% | 70 | 2.92 | 54.22 |
| 10 | BIN | 80.1 GB | 70.3 GB | 87.8% | 273 | 31.71 | 30.66 |
| 11 | BIN | 80.1 GB | 35.5 GB | 44.4% | 294 | 31.75 | 30.61 |
| 12 | SMALL | 13.0 GB | 7.9 GB | 60.7% | 70 | 2.90 | 54.64 |
| 13 | BIN | 80.1 GB | 70.0 GB | 87.5% | 273 | 31.71 | 30.66 |
| 14 | BIN | 80.1 GB | 17.9 GB | 22.4% | 294 | 31.67 | 30.69 |
| TOTAL: 14 | - | 968.5 GB | 375.7 GB | 38.8% | 3231 | 28.00 | - |
| Server | Total | Group | Dist | Duplic | Unapp | TooOld | Site | Line | Other | |
|---|---|---|---|---|---|---|---|---|---|---|
| 1 | 192.168.33.37 | 78789 | 78637 | 0 | 31 | 0 | 0 | 0 | 0 | 121 |
| TOTAL: 1 | 78789 | 78637 | 0 | 31 | 0 | 0 | 0 | 0 | 121 | |
| Newsgroup | Count |
|---|---|
| alt.binaries.department.pron | 12458 |
| alt.binaries.linux.iso | 11164 |
| alt.binaries.teevee | 5585 |
| alt.binaries.town.long.ding.dong | 3825 |
| alt.binaries.town | 2246 |
| alt.binaries.inner-sanctum | 1458 |
| alt.binaries.test2 | 1240 |
| alt.binaries.usenetrevolution | 633 |
| alt.binaries.usc | 567 |
| alt.sex.pictures.erotica | 520 |
| alt.binaries.pictures.erotica.female.ejaculation | 511 |
| alt.binaries.pictures.cheerleaders | 500 |
| alt.binaries.pictures.erotica.nipples | 498 |
| alt.sex.pictues.female | 483 |
| alt.binaries.insiderz | 468 |
| dk.binaer.tv | 442 |
| fur.artwork.erotica | 439 |
| alt.binaries.pictures.eroitca.teen | 425 |
| alt.binaries.pictures.erotica.realwife | 420 |
| alt.binaries.picture.erotica.amature | 415 |
| TOTAL: 530 | 78637 |
| Events | Count |
|---|---|
| CCreader | 5 |
| TOTAL: 1 | 5 |
| Event | Server | Number |
|---|---|---|
| Including strange strings | ||
| 192.168.33.37 | 121 | |
| TOTAL: 1 | 121 | |
| TOTAL: 1 | 121 |
| System | Conn | Arts | Size | Groups | Post | Rej | Elapsed | |
|---|---|---|---|---|---|---|---|---|
| 1 | keyhole.sovam.com | 28 | 56099 | 943.8 MB | 135 | 0 | 0 | 12:10:48 |
| TOTAL: 1 | 28 | 56099 | 943.8 MB | 135 | 0 | 0 | 12:25:32 | |
| System | Conn | Arts | Size | Groups | Post | Rej | Elapsed | |
|---|---|---|---|---|---|---|---|---|
| 1 | *.sovam.com | 28 | 56099 | 943.8 MB | 135 | 0 | 0 | 12:10:48 |
| 2 | *.rol.ru | 5767 | 0 | 0.0 KB | 0 | 0 | 0 | 00:14:36 |
| TOTAL: 2 | 5795 | 56099 | 943.8 MB | 135 | 0 | 0 | 12:25:25 | |
| System | User(ms) | System(ms) | Idle(ms) | Elapsed |
|---|---|---|---|---|
| keyhole.sovam.com | 3.612 | 9.120 | 0.000 | 12:10:48 |
| balancer-a.rol.ru | 4.124 | 3.092 | 0.000 | 00:07:23 |
| balancer-b.rol.ru | 4.056 | 3.124 | 0.000 | 00:07:12 |
| net1-x-ring.tony.pp.ru | 0.220 | 0.148 | 0.000 | 00:00:03 |
| 80.83.238.91 | 0.088 | 0.088 | 0.000 | 00:00:03 |
| ? | 0.012 | 0.028 | 0.000 | 00:00:00 |
| TOTAL: 6 | 12.112 | 15.600 | 0.000 | 12:25:32 |
| System | Conn |
|---|---|
| balancer-a.rol.ru | 2884 |
| balancer-b.rol.ru | 2883 |
| TOTAL: 2 | 5767 |
| System | Conn |
|---|---|
| net1-x-ring.tony.pp.ru | 132 |
| 80.83.238.91 | 61 |
| TOTAL: 2 | 193 |
| System | Conn |
|---|---|
| ? (can't getpeername) | 49 |
| TOTAL: 1 | 49 |
| Category | Count | Pct | |
|---|---|---|---|
| 1 | alt | 56099 | 100.0% |
| TOTAL: 1 | 56099 | 100.0% | |
| Newsgroup | Count | |
|---|---|---|
| 1 | alt.binaries.pictures.scenic | 29468 |
| 2 | alt.binaries.photos.original | 24310 |
| 3 | alt.binaries.pictures.artpics | 2294 |
| 4 | alt.binaries.pictures.animated.gifs | 27 |
| TOTAL: 4 | 56099 | |