| NewsServer Node 2 (perseus) |
Unknown entries from news log file:
First 5 / 13 lines (38.5%)
Jan 5 05:28:08 perseus controlchan[24816]: Unknown "cmsg" control by commandos.bbs@ECEsky.twbbs.org
Jan 5 06:34:22 perseus controlchan[24816]: Unknown "cmsg" control by derder.bbs@bbs.cs.nctu.edu.tw
Jan 5 11:44:53 perseus controlchan[24816]: Unknown "cmsg" control by iamjo.bbs@bbs.cs.nctu.edu.tw
Jan 5 12:58:08 perseus controlchan[24816]: Unknown "cmsg" control by commandos.bbs@ECEsky.twbbs.org
Jan 5 14:04:32 perseus controlchan[24816]: Unknown "cmsg" control by babylin.bbs@bbs.cs.nctu.edu.tw
| Program name | Lines | %Lines | Size | %Size |
|---|---|---|---|---|
| inn | 402052 | 92.3% | 37.3 MB | 90.7% |
| nnrpd | 18177 | 4.2% | 1.8 MB | 4.3% |
| innd | 10813 | 2.5% | 1.3 MB | 3.2% |
| cnfsstat | 4608 | 1.1% | 793.0 KB | 1.9% |
| controlchan | 13 | 0.0% | 1.3 KB | 0.0% |
| TOTAL: 5 | 435663 | 100.0% | 41.1 MB | 100.0% |
| Reason | Count | %Count |
|---|---|---|
| Do not exist | 395447 | 85.4% |
| Negative hits | 63988 | 13.8% |
| Positive hits | 3104 | 0.7% |
| Cache misses | 360 | 0.1% |
| TOTAL: 4 | 462899 | 100.0% |
| Code region | Time | Pct | Invoked | Min(ms) | Avg(ms) | Max(ms) |
|---|---|---|---|---|---|---|
| article cancel | 00:00:00.471 | 0.0% | 4153 | 0.000 | 0.113 | 18.750 |
| article cleanup | 00:00:03.599 | 0.0% | 394846 | 0.000 | 0.009 | 0.037 |
| article logging | 00:01:29.785 | 0.1% | 397819 | 0.000 | 0.226 | 24.272 |
| article parse | 00:01:30.605 | 0.1% | 21792625 | 0.000 | 0.004 | 0.074 |
| article write | 00:30:37.202 | 2.1% | 335284 | 0.167 | 5.480 | 107.453 |
| artlog/artcncl | 00:00:00.035 | 0.0% | 4146 | 0.000 | 0.008 | 1.000 |
| artlog/artparse | 00:00:00.001 | 0.0% | 35 | 0.000 | 0.029 | 1.000 |
| data move | 00:00:25.410 | 0.0% | 23120929 | 0.000 | 0.001 | 0.011 |
| hisgrep/artcncl | 00:00:00.205 | 0.0% | 3283 | 0.000 | 0.062 | 11.333 |
| hishave/artcncl | 00:00:00.009 | 0.0% | 4153 | 0.000 | 0.002 | 1.000 |
| history grep | 00:00:00.000 | 0.0% | 0 | 0.000 | 0.000 | 0.000 |
| history lookup | 00:00:02.272 | 0.0% | 459114 | 0.000 | 0.005 | 0.025 |
| history sync | 00:00:00.277 | 0.0% | 425 | 0.000 | 0.652 | 24.000 |
| history write | 00:06:40.488 | 0.5% | 335284 | 0.000 | 1.194 | 33.477 |
| hiswrite/artcncl | 00:00:00.198 | 0.0% | 870 | 0.000 | 0.228 | 37.500 |
| idle | 21:36:12.632 | 90.0% | 21721347 | 0.000 | 3.580 | 23.486 |
| nntp read | 00:01:46.895 | 0.1% | 21816906 | 0.000 | 0.005 | 0.086 |
| overview write | 01:38:14.238 | 6.8% | 335284 | 1.961 | 17.580 | 9767.000 |
| perl filter | 00:00:00.000 | 0.0% | 0 | 0.000 | 0.000 | 0.000 |
| python filter | 00:00:00.000 | 0.0% | 0 | 0.000 | 0.000 | 0.000 |
| site send | 00:00:00.000 | 0.0% | 13 | 0.000 | 0.000 | 0.000 |
| TOTAL: 23:59:57.385 | 23:57:04.322 | 99.8% | - | - | - | - |
| Code region | Time | Pct | Invoked | Min(ms) | Avg(ms) | Max(ms) |
|---|---|---|---|---|---|---|
| hisgrep | 00:00:04.160 | 0.0% | 19432 | 0.000 | 0.214 | 0.000 |
| idle | 14:17:21.660 | 99.0% | 45001 | 7.000 | 1143.123 | 1309.649 |
| newnews | 00:00:00.000 | 0.0% | 0 | 0.000 | 0.000 | 0.000 |
| nntpwrite | 00:01:38.472 | 0.2% | 134797 | 0.000 | 0.731 | 0.000 |
| readart | 00:04:00.618 | 0.5% | 38996 | 0.000 | 6.170 | 0.000 |
| TOTAL: 14:25:54.053 | 14:23:04.910 | 99.7% | - | - | - | - |
| Command | Number |
|---|---|
| flush | 144 |
| flushlogs | 1 |
| paused | 2 |
| TOTAL: 3 | 147 |
| Server | Connects | Offered | Taken | Refused | Reject | %Accpt | Elapsed | |
|---|---|---|---|---|---|---|---|---|
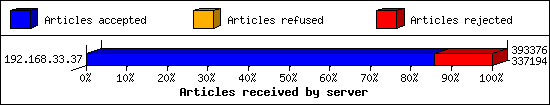
| 1 | 192.168.33.37 | 1342 | 393376 | 337194 | 65 | 56117 | 85% | 279:24:16 |
| TOTAL: 1 | 1342 | 393376 | 337194 | 65 | 56117 | 85% | 279:24:16 | |
| Server | AcceptVol | DupVol | TotalVol | %Acc | Vol/Art | Elapsed | |
|---|---|---|---|---|---|---|---|
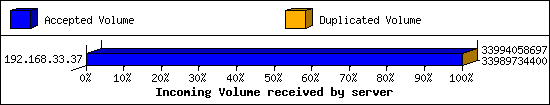
| 1 | 192.168.33.37 | 31.7 GB | 4.1 MB | 31.7 GB | 99% | 84.4 KB | 279:24:16 |
| TOTAL: 1 | 31.7 GB | 4.1 MB | 31.7 GB | 99% | 84.4 KB | 279:24:16 | |
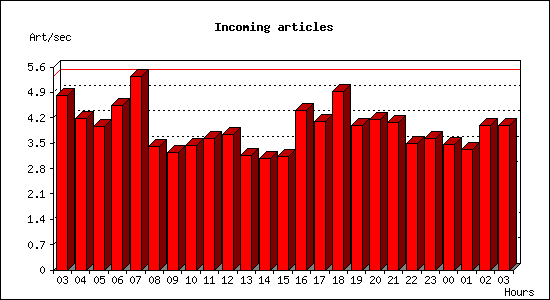
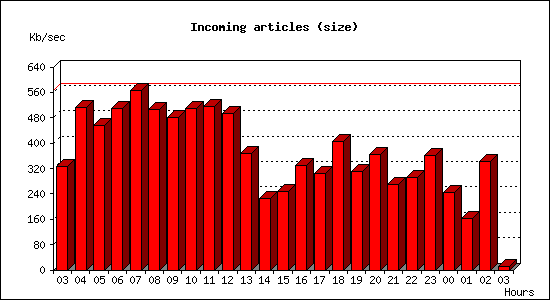
| Date | Articles | %Arts | Art/sec | Size | %Size | KB/sec |
|---|---|---|---|---|---|---|
| Jan 5 03:00:01 - 03:59:59 | 17370 | 5.2% | 4.83 | 1.1 GB | 3.6% | 326.29 |
| Jan 5 04:00:00 - 04:59:59 | 15081 | 4.5% | 4.19 | 1.8 GB | 5.6% | 513.48 |
| Jan 5 05:00:00 - 05:59:59 | 14271 | 4.3% | 3.96 | 1.6 GB | 5.0% | 456.98 |
| Jan 5 06:00:00 - 06:59:59 | 16310 | 4.9% | 4.53 | 1.7 GB | 5.6% | 509.10 |
| Jan 5 07:00:00 - 07:59:59 | 19188 | 5.7% | 5.33 | 1.9 GB | 6.2% | 565.51 |
| Jan 5 08:00:00 - 08:59:59 | 12259 | 3.7% | 3.41 | 1.7 GB | 5.5% | 504.78 |
| Jan 5 09:00:00 - 09:59:59 | 11640 | 3.5% | 3.23 | 1.7 GB | 5.3% | 482.34 |
| Jan 5 10:00:00 - 10:59:59 | 12382 | 3.7% | 3.44 | 1.8 GB | 5.6% | 510.65 |
| Jan 5 11:00:00 - 11:59:59 | 13078 | 3.9% | 3.63 | 1.8 GB | 5.7% | 516.48 |
| Jan 5 12:00:00 - 12:59:59 | 13410 | 4.0% | 3.73 | 1.7 GB | 5.4% | 494.52 |
| Jan 5 13:00:00 - 13:59:59 | 11390 | 3.4% | 3.16 | 1.3 GB | 4.0% | 367.77 |
| Jan 5 14:00:00 - 14:59:59 | 11064 | 3.3% | 3.07 | 796.6 MB | 2.5% | 226.60 |
| Jan 5 15:00:00 - 15:59:59 | 11231 | 3.3% | 3.12 | 874.4 MB | 2.7% | 248.72 |
| Jan 5 16:00:00 - 16:59:59 | 15809 | 4.7% | 4.39 | 1.1 GB | 3.6% | 330.36 |
| Jan 5 17:00:00 - 17:59:59 | 14769 | 4.4% | 4.10 | 1.0 GB | 3.3% | 303.10 |
| Jan 5 18:00:00 - 18:59:59 | 17751 | 5.3% | 4.93 | 1.4 GB | 4.4% | 404.27 |
| Jan 5 19:00:00 - 19:59:59 | 14335 | 4.3% | 3.98 | 1.1 GB | 3.4% | 311.55 |
| Jan 5 20:00:00 - 20:59:59 | 14972 | 4.5% | 4.16 | 1.3 GB | 4.0% | 364.15 |
| Jan 5 21:00:00 - 21:59:59 | 14644 | 4.4% | 4.07 | 952.7 MB | 3.0% | 271.00 |
| Jan 5 22:00:00 - 22:59:59 | 12528 | 3.7% | 3.48 | 1.0 GB | 3.2% | 292.45 |
| Jan 5 23:00:00 - 23:59:59 | 13030 | 3.9% | 3.62 | 1.2 GB | 4.0% | 361.92 |
| Jan 6 00:00:00 - 00:59:59 | 12513 | 3.7% | 3.48 | 858.8 MB | 2.7% | 244.29 |
| Jan 6 01:00:00 - 01:59:59 | 11933 | 3.6% | 3.31 | 573.2 MB | 1.8% | 163.06 |
| Jan 6 02:00:00 - 02:59:59 | 14338 | 4.3% | 3.98 | 1.2 GB | 3.8% | 342.72 |
| Jan 6 03:00:00 - 03:00:01 | 4 | 0.0% | 4.00 | 12.2 KB | 0.0% | 12.24 |
| TOTAL: 24:00:00 | 335300 | 100.0% | 3.88 | 31.3 GB | 100.0% | 379.67 |
| Buffer | Class | Size | Used | %Used | Cycles | KB/sec | Days |
|---|---|---|---|---|---|---|---|
| 01 | BIN | 137.8 GB | 15.7 GB | 11.4% | 236 | 62.18 | 26.90 |
| 02 | BIN | 137.8 GB | 100.6 GB | 73.0% | 236 | 61.71 | 27.10 |
| 03 | SMALL | 13.0 GB | 8.2 GB | 63.0% | 44 | 4.00 | 39.58 |
| 04 | BIN | 80.1 GB | 78.9 GB | 98.5% | 183 | 30.97 | 31.39 |
| 05 | BIN | 80.1 GB | 21.3 GB | 26.6% | 204 | 31.07 | 31.28 |
| 06 | SMALL | 13.0 GB | 8.2 GB | 62.5% | 44 | 3.97 | 39.88 |
| 07 | BIN | 80.1 GB | 58.5 GB | 73.0% | 183 | 31.12 | 31.24 |
| 08 | BIN | 80.1 GB | 5.5 GB | 6.9% | 204 | 30.85 | 31.50 |
| 09 | SMALL | 13.0 GB | 6.9 GB | 52.7% | 44 | 3.95 | 40.02 |
| 10 | BIN | 80.1 GB | 43.6 GB | 54.4% | 183 | 30.84 | 31.52 |
| 11 | BIN | 80.1 GB | 43.5 GB | 54.4% | 204 | 31.07 | 31.28 |
| 12 | SMALL | 13.0 GB | 8.0 GB | 61.1% | 44 | 3.98 | 39.77 |
| 13 | BIN | 80.1 GB | 40.7 GB | 50.8% | 183 | 31.02 | 31.34 |
| 14 | BIN | 80.1 GB | 6.8 GB | 8.5% | 204 | 31.12 | 31.24 |
| TOTAL: 14 | - | 968.5 GB | 446.3 GB | 46.1% | 2196 | 27.70 | - |
| Server | Total | Group | Dist | Duplic | Unapp | TooOld | Site | Line | Other | |
|---|---|---|---|---|---|---|---|---|---|---|
| 1 | 192.168.33.37 | 62571 | 59480 | 0 | 117 | 0 | 0 | 0 | 0 | 2974 |
| 2 | ? | 34 | 0 | 0 | 0 | 0 | 0 | 0 | 0 | 34 |
| TOTAL: 2 | 62605 | 59480 | 0 | 117 | 0 | 0 | 0 | 0 | 3008 | |
| Newsgroup | Count |
|---|---|
| gmane.linux.ubuntu.bugs.general | 792 |
| gmane.linux.redhat.fedora.extras.cvs | 699 |
| alt.binaries.kleverig | 636 |
| gmane.comp.kde.bugs | 604 |
| gmane.comp.kde.devel.bugs | 604 |
| alt.binaries.mp3s.mixed | 490 |
| alt.binaries.boneless.nl | 464 |
| alt.binaries.al | 462 |
| gmane.comp.kde.cvs | 389 |
| gmane.comp.web.chromium.bugs | 380 |
| gmane.linux.kernel | 348 |
| gmane.linux.arch.scm | 348 |
| gmane.linux.debian.devel.bugs.general | 334 |
| alt.binaries.pictures.teen.models | 319 |
| gmane.comp.gnome.svn | 278 |
| gmane.linux.gentoo.cvs | 272 |
| gmane.user-groups.linux.czech | 270 |
| alt.binaries.town | 269 |
| alt.binaries.x264 | 248 |
| gmane.linux.debian.backports.changes | 246 |
| TOTAL: 3820 | 59480 |
| Events | Count |
|---|---|
| CCreader | 1 |
| TOTAL: 1 | 1 |
| Event | Server | Number |
|---|---|---|
| Including strange strings | ||
| 192.168.33.37 | 2973 | |
| TOTAL: 1 | 2973 | |
| TOTAL: 1 | 2973 |
| System | Conn | Arts | Size | Groups | Post | Rej | Elapsed | |
|---|---|---|---|---|---|---|---|---|
| 1 | keyhole.sovam.com | 42 | 19432 | 319.4 MB | 168 | 0 | 0 | 14:12:52 |
| TOTAL: 1 | 42 | 19432 | 319.4 MB | 168 | 0 | 0 | 14:25:55 | |
| System | Conn | Arts | Size | Groups | Post | Rej | Elapsed | |
|---|---|---|---|---|---|---|---|---|
| 1 | *.sovam.com | 42 | 19432 | 319.4 MB | 168 | 0 | 0 | 14:12:52 |
| 2 | *.rol.ru | 5759 | 0 | 0.0 KB | 0 | 0 | 0 | 00:12:56 |
| TOTAL: 2 | 5801 | 19432 | 319.4 MB | 168 | 0 | 0 | 14:25:48 | |
| System | User(ms) | System(ms) | Idle(ms) | Elapsed |
|---|---|---|---|---|
| keyhole.sovam.com | 1.260 | 3.460 | 0.000 | 14:12:52 |
| balancer-b.rol.ru | 3.776 | 3.440 | 0.000 | 00:06:54 |
| balancer-a.rol.ru | 3.952 | 3.688 | 0.000 | 00:06:01 |
| net1-x-ring.tony.pp.ru | 0.152 | 0.180 | 0.000 | 00:00:06 |
| ppp83-237-13-224.pppoe.mtu-net.ru | 0.004 | 0.000 | 0.000 | 00:00:00 |
| TOTAL: 5 | 9.144 | 10.768 | 0.000 | 14:25:55 |
| System | Conn |
|---|---|
| balancer-a.rol.ru | 2880 |
| balancer-b.rol.ru | 2879 |
| TOTAL: 2 | 5759 |
| System | Conn |
|---|---|
| net1-x-ring.tony.pp.ru | 127 |
| ppp83-237-13-224.pppoe.mtu-net.ru | 3 |
| TOTAL: 2 | 130 |
| Category | Count | Pct | |
|---|---|---|---|
| 1 | alt | 19513 | 100.0% |
| TOTAL: 1 | 19513 | 100.0% | |
| Newsgroup | Count | |
|---|---|---|
| 1 | alt.binaries.pictures.scenic | 15996 |
| 2 | alt.binaries.photos.nude-art | 2626 |
| 3 | alt.binaries.pictures.military | 891 |
| TOTAL: 3 | 19513 | |